
Executive Summary
Violent crime concentrates geographically, and the concentration is extreme. Across nine cities analyzed for this paper, roughly 3–5% of city geography accounts for 20% of all violent crime. The pattern holds everywhere: a small number of places carry a vastly disproportionate share of violence. Code violations, 311 complaints, and illegal dumping cluster in much of the same territory. For residents in these areas, citywide statistics showing declining crime can feel meaningless, and they're right to say so.
Violent crime's geographic concentration is not static. It shifts substantially from year to year. The measured concentration churns: in a typical city, a third to half of the highest-crime micro-areas are different from one year to the next. Some of that turnover reflects genuine shifts in conditions — a corridor deteriorates, a problem property attracts activity. Some of it reflects the inherent volatility of small-number crime data, where a handful of additional incidents can push a neighborhood across a threshold. But from the standpoint of a city trying to direct resources, the distinction doesn't matter much. Either way, last year's priority list is wrong. The geography that shows up in your data moves, and your response has to move with it.
The good news: the broad trend is favorable, and the real target is small. Violent crime is declining nationally and in most cities, including in chronically high-crime neighborhoods. Across nine cities, roughly 90% of geography is stable from year to year, and where crime is genuinely shifting, improvement outpaces deterioration by nearly five to one. The places trending in the wrong direction represent just 1–3% of city geography in any given year — roughly 20 to 30 half-mile areas in a typical city. That's not an overwhelming problem. It's a list that fits on a single page. But each of those areas, once you're on the ground, contains dozens of specific problems at specific addresses, each one owned by a different city department. The targeting tells you where to look. The harder part is coordinating the response: getting the right agencies to the right addresses, tracking follow-through, and sustaining engagement over time.
Cities can respond rapidly using capacity they already have. Environmental interventions — cleaning vacant lots, fixing streetlights, citing blighted properties, removing illegal dumping — can be directed to specific blocks within weeks and redirected as conditions shift. The departments that deliver this work — code enforcement, sanitation, public works, parks — already exist, already have staff and budgets, and already do this work every day. What they typically lack is a system that tells them where it matters most this week. Policing reform and large-scale social programs matter immensely but are slow, expensive, or politically contentious. Environmental interventions occupy a different space: fast, adaptive, and deliverable with existing resources. And because geographic concentration characterizes not just violence but also 311 requests, code violations, and other indicators of neighborhood distress, the same coordination model serves multiple city priorities at once.
These interventions work, and they work best when paired with a back-office engine that keeps them targeted. Randomized trials have shown that greening vacant lots reduces nearby gun violence by 29% and that improved street lighting cuts outdoor nighttime crime by 39%. But the evidence also suggests that isolated, one-off deployments lose their effect. What sustains impact is a coordination system that combines data-driven targeting with operational follow-through: identifying the small number of places trending the wrong way, assigning the right agencies, and retargeting as conditions shift. In our own local government public safety work, we have seen firsthand how this coordinated approach gets results. This is especially true in Dallas. In 2024–2025, the city deployed coordinated environmental interventions across departments, retargeting weekly. At every risk level, areas that received intervention outperformed comparable areas that did not — and the effect was strongest in areas at the tipping point between stability and escalation. Section 4 presents the full case study.
Any city can start in 90 days with existing staff and data. This approach does not require new programs, new hires, or new funding. It requires a coordinator, a short list of priority locations drawn from frequently updated data, and a commitment to regular cross-agency meetings. Cities that sustain this work treat it as an operating rhythm — not a one-time campaign. The goal is not a single program but a way of directing city government toward wherever concentrated need emerges, adapting as that geography shifts.
Where Violence Is — and How It Moves
Violent crime devastates individuals, families, and communities. Beyond the direct harm to victims, persistent violence erodes trust in government and makes future violence more likely. Where violent crime is common and sustained, the failure to reduce it is widely perceived as a failure of government itself.
Understanding where violence concentrates, and how that concentration changes over time, is the foundation for any place-based strategy.
The broad decline is real
On average, Americans today are roughly half as likely to be the victim of a violent crime as they were in the early 1990s. This decline is one of the most significant and undercelebrated public safety achievements of the last fifty years. After a sharp spike during the COVID-19 pandemic (homicides surged roughly 30% in 2020), violent crime has resumed its downward trajectory. By 2025, national homicide rates had fallen below pre-pandemic levels to their lowest point in over sixty years.
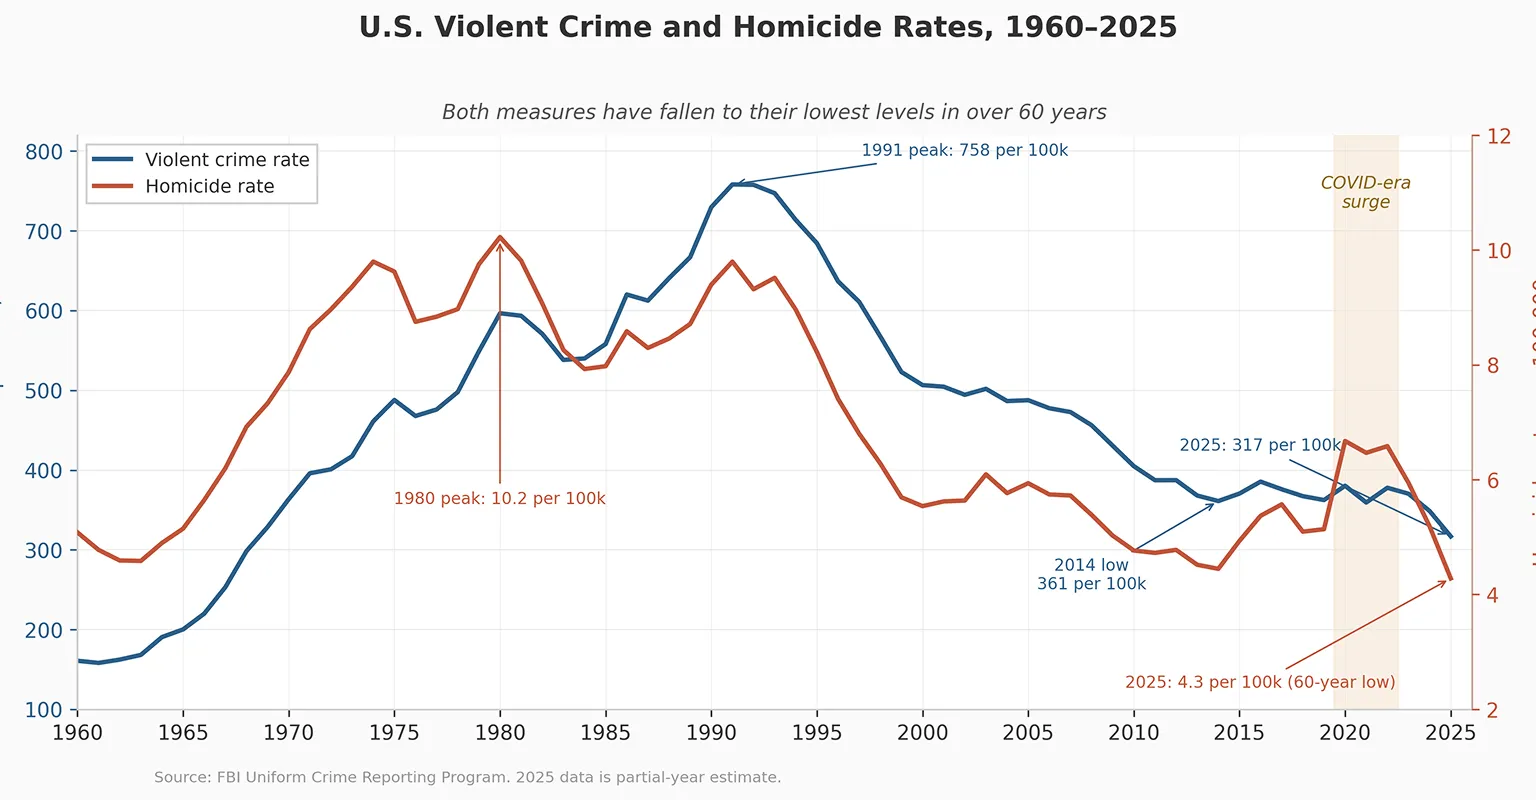
This isn't just a national average. Eight of nine cities analyzed for this paper saw violent crime decline from 2024 to 2025, with citywide drops ranging from 3% to 24%.
Concentration is devastating where it lands
But that broad decline coexists with a well-documented local reality: violent crime concentrates geographically. What criminologists call the "law of crime concentration" — formalized by David Weisburd in 2015 — holds that a small share of places accounts for a disproportionate share of crime. A study of six major U.S. cities found that 3% to 10% of street segments accounted for half of all crime.
This concentration is extreme. In Dallas, the geography containing the top 20% of violent crime represents just 3.4% of the city. In New York, 2.5%. In Denver, 1.6%. For residents living in these areas, the national decline can feel invisible. The danger is real and the frustration is legitimate.
Former Baltimore Mayor and Maryland Governor, and current 17A Senior Advisor Martin O’Malley saw this dynamic firsthand. “When I was mayor of Baltimore, I’d walk neighborhoods where three or four shootings had happened in a month, and someone would always say, ‘They keep telling us crime is going down. Where?’” he recalls. “They weren’t wrong. Citywide numbers were improving, but violence had moved onto their block that year, and that was all that mattered to them.”
What's actually changing
The common assumption is that the same neighborhoods stay dangerous year after year while the rest of the city improves. The data tells a different story.
When you test whether year-over-year changes in each half-mile area reflect an emerging trend — rather than the normal ups and downs you'd expect from small numbers — a clear picture emerges across ten cities.
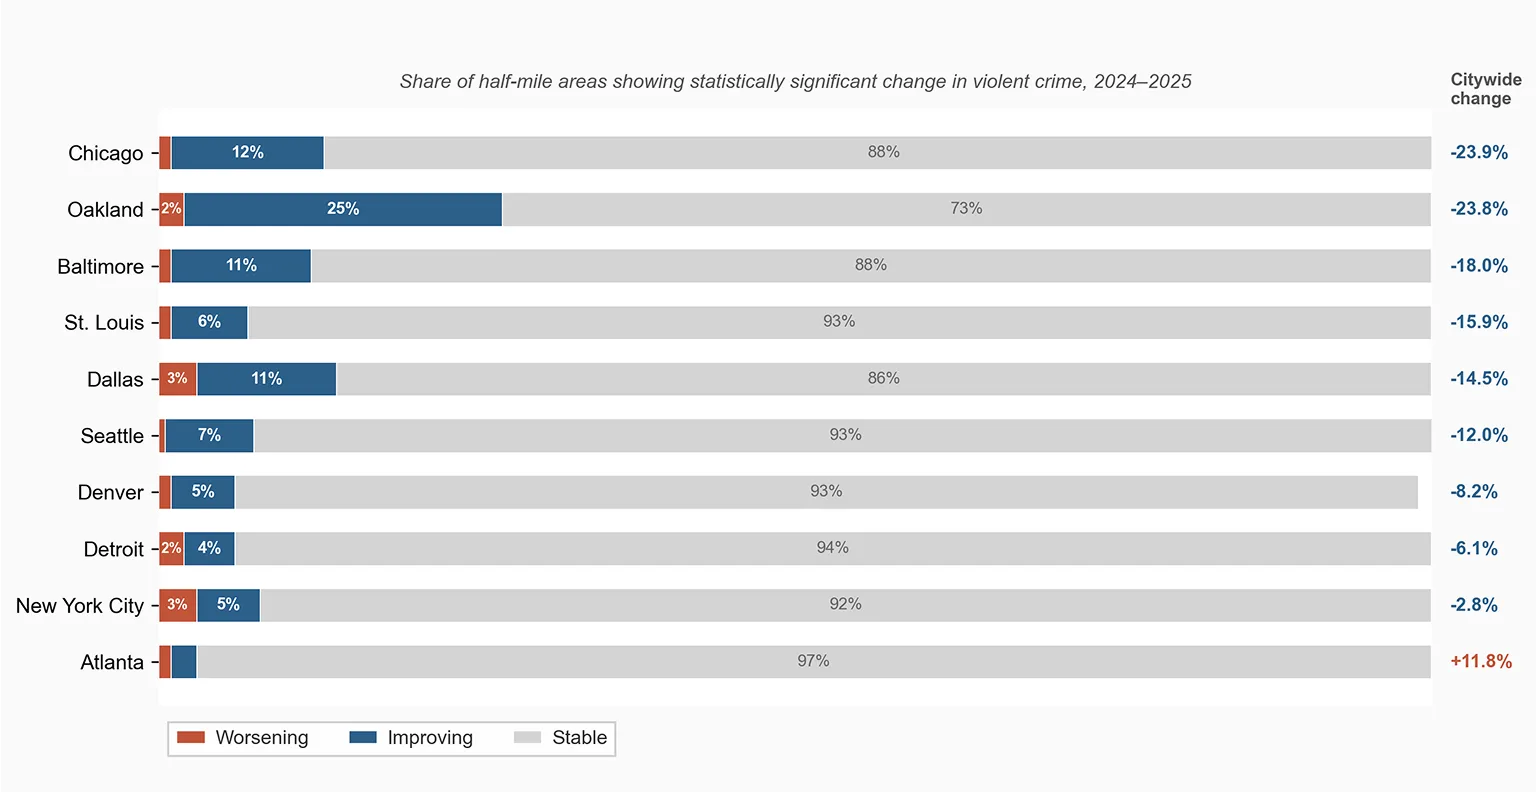
This is what "crime is going down" actually looks like at the neighborhood level. It's not a uniform decline everywhere. There is broad stability across most of most cities, concentrated improvement in a relatively small number of places, and a much smaller number of places moving in the wrong direction. That last group — the 1–3% where violence is escalating — is where targeted intervention can have the greatest impact.
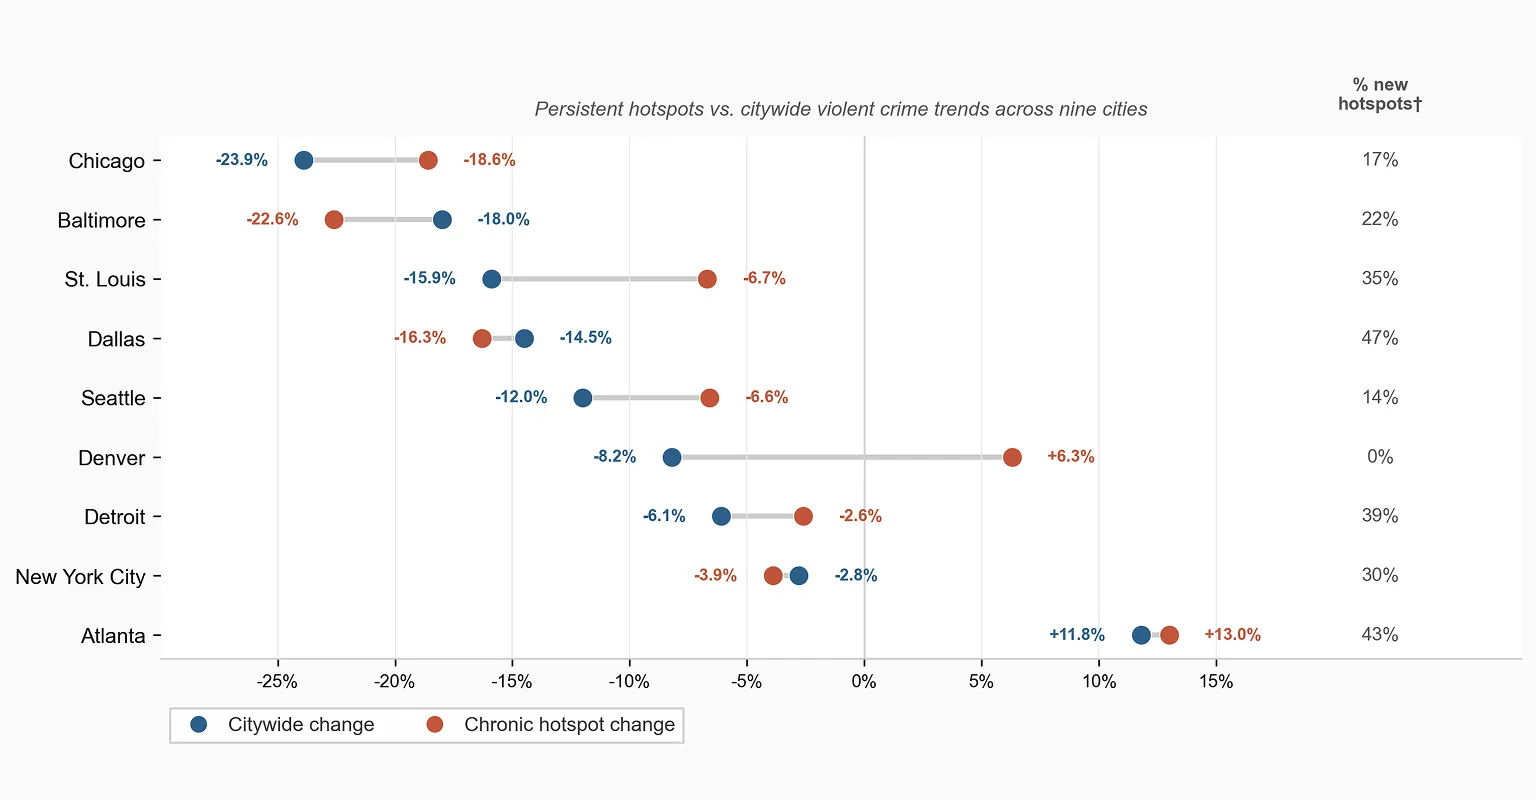
There are exceptions. Denver's chronic hotspots worsened even as the city overall improved. Atlanta's worsened alongside a citywide increase. But the dominant pattern — in seven of nine cities — is that persistently high-crime areas are declining. They are not being left behind.
The real policy target is small.Even as overall concentration persists — roughly 3–5% of city geography continues to account for 20% of violent crime, year after year — the specific locations shift. In Dallas, nearly half of the cells in the highest-concentration tier in 2025 were not in that tier in 2024. This is not a Dallas anomaly. Across nine cities, the geography of concentration reshuffles substantially every year — with year-over-year overlap in the highest tier ranging from just 28% (Dallas) to 79% (Denver). Wheeler and Reuter (2021) found the same pattern in their analysis of Dallas hotspots: traditionally defined boundaries fail to capture how concentration moves over time.
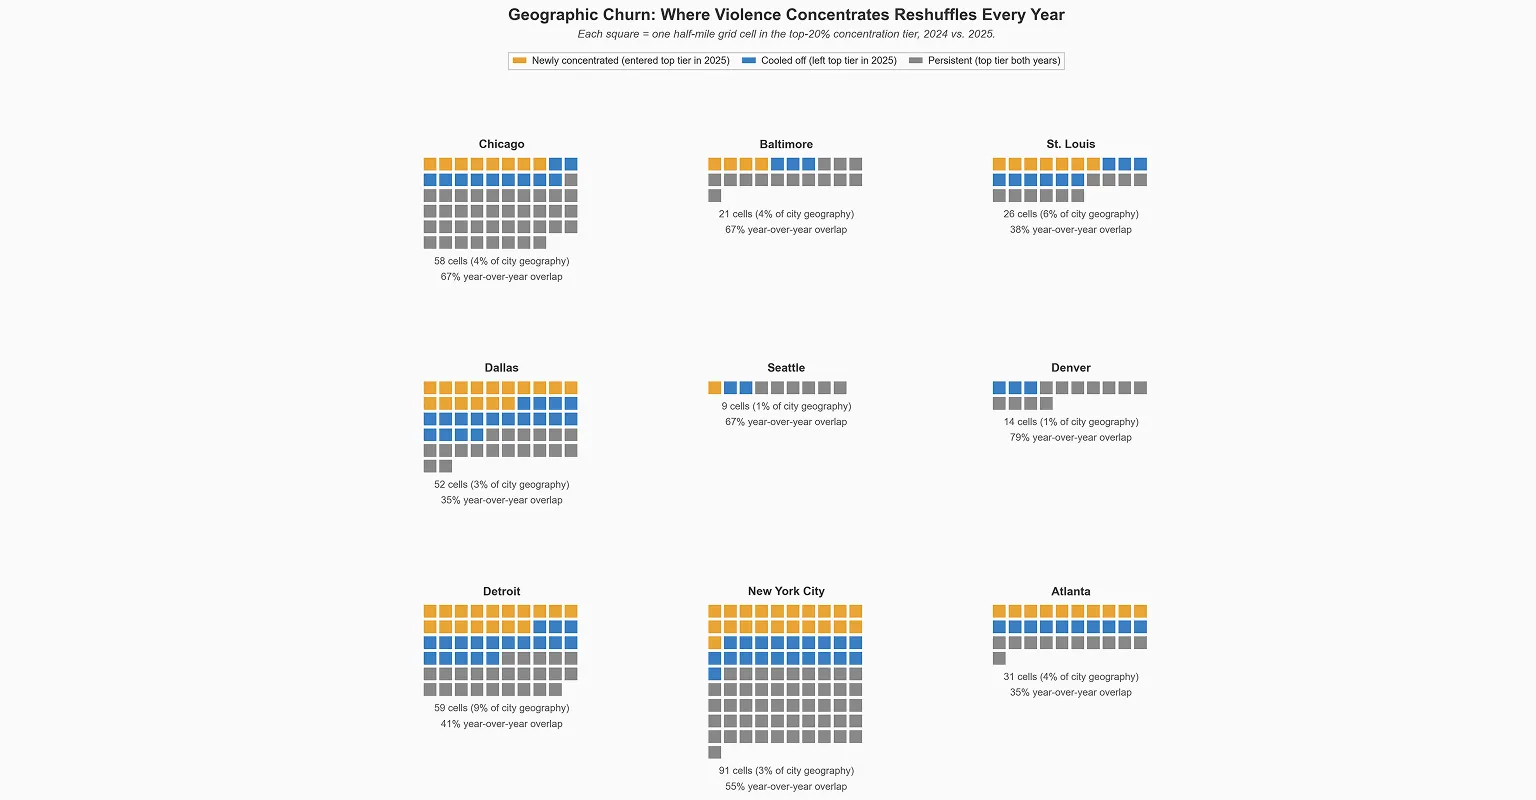
Understanding this rotation is important. Some of it reflects real shifts — a corridor deteriorates, a problem property attracts activity, a previously stable area starts trending the wrong way. Some of it is simply the nature of small numbers: an area with 3 violent crimes one year and 7 the next can cross a concentration threshold without anything fundamental having changed. The stability analysis helps distinguish between the two. When you focus on the areas where the change is large enough to indicate a genuine trend, the picture sharpens considerably: the places where violence is escalating in a given year represent roughly 1–3% of city geography. In Dallas, that was 26 half-mile areas. That's not an overwhelming problem. That's a list that fits on a single page — and it's where targeted intervention can do the most good.
Why this matters for city leaders
This reframes the challenge. The question for a new mayor or deputy mayor isn't "how do we fix every high-crime neighborhood?" Most of the city is stable, chronic hotspots are generally improving, and the broad trend is your ally. The question is: can you identify the small number of places — roughly 20 to 30 at any given time — where violence is escalating, and can you get there fast enough to make a difference?
That's not a resource problem. It's a detection and coordination problem. You don't need new programs, new staff, or new funding to respond to 25 locations. You need a system that can spot the emerging trouble spots and redirect existing city capacity — code enforcement, public works, streetlights, property maintenance — toward those places on a rolling basis. And you need that system to be adaptive, because the list will change.
This pattern — geographic concentration that persists structurally even as the specific locations shift — is not unique to violent crime. Cities see similar dynamics in 311 service requests, code violations, illegal dumping complaints, and other indicators of neighborhood distress. The places generating the most service demand rotate over time, even as the overall level of concentration stays roughly constant. Violence is the highest-stakes version of a more general phenomenon: city resources need to follow shifting geographic need, and most cities aren't set up to do that. We focus on violence in this paper because the consequences of getting it wrong are most severe and the data is most granular — but the coordination model described in Sections 4 and 6 applies wherever concentrated need moves faster than the city's response.
The next section explains why environmental interventions — the kind of work those city departments already do — are effective at reducing violence. The section after that shows how one city built the coordination system to deploy them.
Environmental Interventions
Most public safety strategies fall into two familiar categories. The first is political: policing reform, criminal justice policy, sentencing changes. These debates are important, but they are slow, contentious, and often outside the direct control of city government. The second is expensive: housing, behavioral health, workforce development, large-scale social programs. These investments matter immensely, but they require significant new resources and take years to show results.
There is a third category that is neither political nor expensive: environmental interventions. These strategies focus on the physical conditions of places where violence concentrates, and can often be deployed quickly using existing city capacity.
What the research shows
Environmental interventions address what a block or corridor looks like, how it is maintained, and what behaviors it enables or discourages. A substantial body of research shows that improving physical environments in high-violence locations can meaningfully reduce crime:
A randomized controlled trial in Philadelphia found that cleaning and greening vacant lots reduced nearby gun violence by 29% (Branas et al., 2018).
A study of New York City public housing found that improved street lighting led to a 39% reduction in outdoor nighttime crimes, including violent offenses (Chalfin et al., 2021).
Additional studies show consistent benefits from graffiti removal, trash cleanup, and securing abandoned buildings.These effects occur not simply because places look better, but because environmental conditions shape opportunity, visibility, and social norms. Well-maintained spaces are harder to use for illicit activity and signal that someone is paying attention.
Governor O’Malley describes a similar dynamic from his time in Baltimore. “Residents always knew which vacant lot was the problem, which streetlight had been out for months. When the city finally showed up and addressed those things, people noticed overnight. You’d hear it at the next community meeting. And the guys who had been using that corner noticed too.”
The agencies that can deliver
The departments that can execute environmental interventions already exist in every city government. They already do this work, just not necessarily in the places where it would have the greatest impact on violence.
Code Enforcement is often the anchor agency. Code officers can issue citations, conduct property assessments, and pursue nuisance abatement for persistently problematic addresses. The approach may vary depending on the property owner: a large institutional landlord with a pattern of neglect warrants a different enforcement posture than an elderly longtime homeowner who may need support navigating repairs.
Sanitation handles trash removal and illegal dumping cleanup, visible signs of disorder that shape how a space feels and whether it attracts further neglect.
Public Works maintains lighting, signage, and infrastructure. Broken streetlights and missing signage create opportunities for crime and signal that no one is watching.
Transportation can install barriers, adjust signal timing, add crosswalks, and improve street signage to improve safety and visibility.
Parks and Recreation can green vacant land, maintain public spaces, and activate underused areas to increase legitimate foot traffic and community presence.
The gaps: targeting and coordination
These agencies already have staff. They already have budgets. They already do cleanups, inspections, and repairs every day. What they typically lack are two things:
Targeting: A clear, data-driven answer to the question: which blocks should we prioritize? This requires combining crime data with local knowledge, identifying not just where violence has occurred but where conditions are ripest for it to continue. And because the geography of violence shifts over time, targeting must be updated frequently enough to keep pace with changing conditions. As Section 2 describes, the number of areas trending in the wrong direction at any given time is small, roughly 20 to 30 in a typical city. That's a manageable list. But it's only the first scale of the problem.
Coordination: Each of those 20 to 30 areas, once you're on the ground, contains dozens of specific problems at specific addresses: a vacant lot that needs clearing, a streetlight that's been out for months, a blighted property that needs a code citation, illegal dumping that needs cleanup, a bus stop that's become a gathering point. A single corridor might involve four or five different departments. The targeting tells you where to look. Coordination is what gets the right agencies to the right addresses, tracks whether the work is actually happening, and ensures repeat engagement over time. Without that management structure, even well-targeted efforts fade after the first visit.
When city leadership provides both—clear priorities and a structure to execute on them—routine city functions become a coordinated response to the places where multiple forms of need concentrate. Violence reduction is the highest-stakes application, but the same coordination structure addresses blight, illegal dumping, lighting failures, and the 311 backlogs that erode residents' confidence in city government.
Case Study: The Dallas Model
In 2024–2025, Dallas tested what this approach looks like in practice. The city's leadership, in close partnership with Child Poverty Action Lab (“CPAL”), committed to treating violence reduction as a broader quality of life problem in the city. City leaders reframed violent crime as a cross-agency coordination problem, not a policing problem, and directed departments that shape physical environments toward the places where violence was concentrating.
The effort was part of a long-running partnership between the City of Dallas and CPAL. CPAL's working team built an analytical infrastructure that made targeting possible, translated data into operational priorities on a weekly cycle, and kept the work accountable to outcomes. City departments (code enforcement, transportation, and public works) executed the interventions. CPAL's program personnel ensured the initial list of priorities was aligned with neighborhood realities, and built a process for site validation that the City is now carrying forward.
The results offer the clearest available evidence that coordinated, place-based environmental intervention works with existing city resources.
What Dallas did
The city organized the work around four ideas.
First, city leadership made it clear that violence reduction was a cross-agency priority. Department heads heard directly from the City that they would be expected to prioritize specific high-violence locations and report on progress. This was a core expectation from management.
Second, the working team maintained a short, continuously updated list of priority locations. Our analysts combined crime data, code violations, 311 complaints, and environmental indicators to identify roughly 50–100 sites at any given time. Critically, the list wasn't static. As conditions shifted (some areas stabilizing, others deteriorating), the team shifted the targeting with them, typically on a weekly cycle. This is exactly the adaptive approach Section 2 argues is necessary: targeting that moves as the geography of violence moves.
Third, coordination happened on a regular weekly cadence. The team reviewed targeting data and field intelligence every Monday, updating priorities based on the latest conditions. Separate meetings with operational departments on Tuesdays, facilitated by CPAL, tracked active cases, assigned follow-ups, and closed out completed work. Throughout the week, field staff visited sites, assessed conditions, and gathered the context that CPAL fed back into the next cycle's targeting. CPAL functioned as the connective tissue between data and action, ensuring that what the numbers showed actually translated into work on the ground.
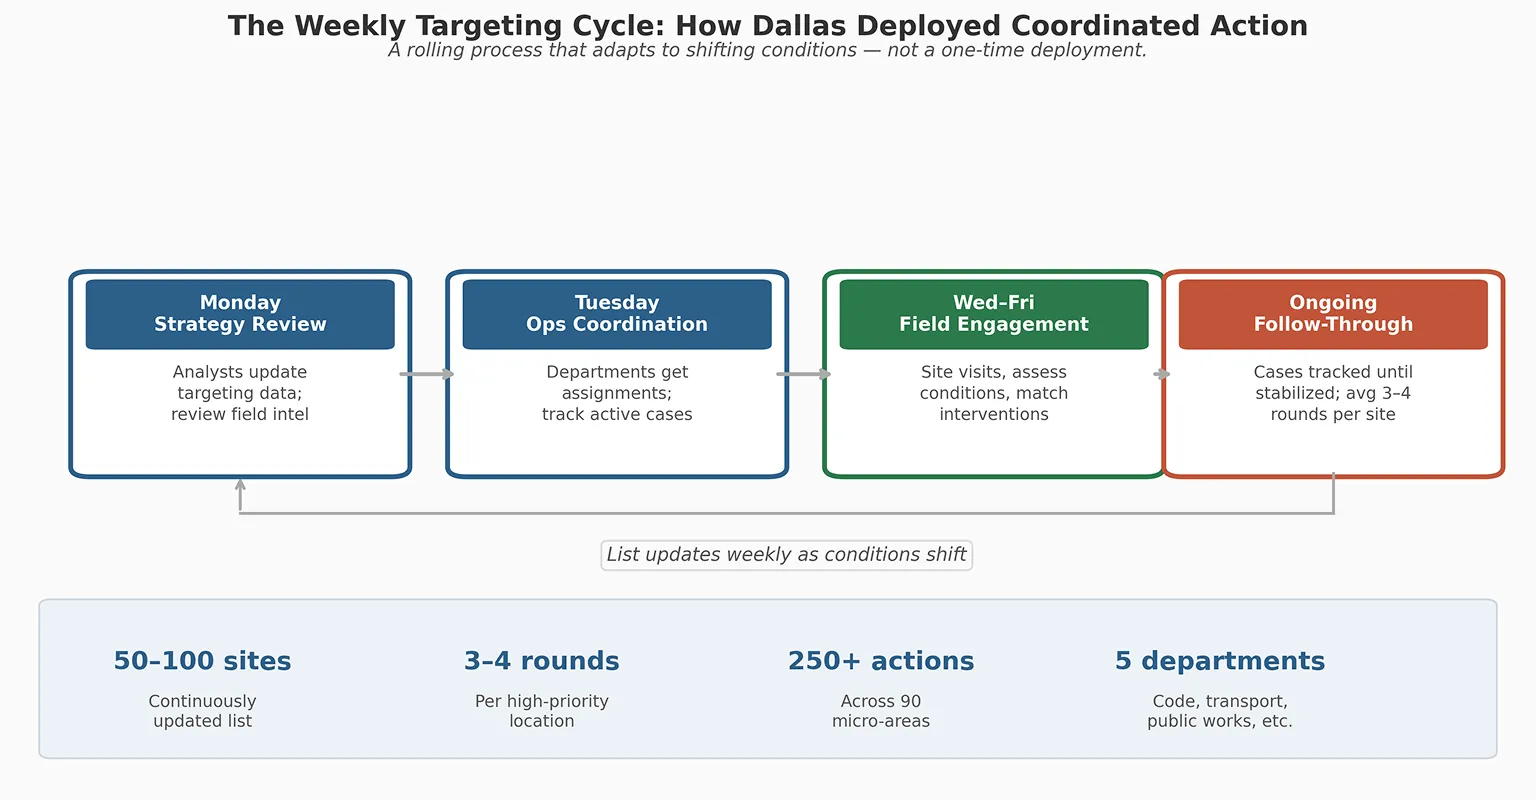
Fourth, every site had clear ownership and follow-through. Departments tracked their cases in shared systems, updating progress as work moved. Sites stayed on the active list until conditions stabilized, not until the first intervention was complete. On average, high-priority locations received multiple rounds of engagement over several months.
What the work looked like
The team's targeting identified where to focus. But each priority area, once you're on the ground, contained dozens of specific problems at specific addresses, each one the responsibility of a different department. Ninety micro-areas produced over 250 completed interventions spanning vegetation clearing, streetlight repairs, trash and dumping cleanup, property citations, and infrastructure fixes. CPAL's Neighborhood's team was the core translation layer between data-driven prioritization and work assignment.
Some sites had clear solutions. After a murder near an apartment in Old East Dallas, the team assessed a vacant lot sandwiched between a cottage and a modern three-story building. The lot had ankle-high grass, graffiti on the fence, and old streetlights. The diagnosis was straightforward: cut back vegetation, paint over graffiti, convert streetlights to LED bulbs. Within two weeks, the grass was cut. The remaining items were in progress. When people feel safe walking around, there are more eyes and ears to report issues, and more community investment in maintaining the improvement.
Other sites didn't have a two-week fix. A house near the intersection of North Buckner Boulevard and Peavy Road in Far East Dallas presented a different challenge. The property's out-of-state owner had let it become a camp for people experiencing homelessness. Across the street, a beer store clerk described constant drug activity and 911 calls. A bus stop nearby had become a gathering point for people who never boarded buses. A surveillance camera tower installed months earlier hadn't deterred drug dealing beneath it. The team considered options: work with Dallas Area Rapid Transit to remove the bench, increase patrols, pursue the absentee landlord through community prosecution. They took the clerk's information and promised to return. This area would likely require months of repeat visits across dozens of interventions.
As Kevin Oden, Dallas's director of Emergency Management and Crisis Response, put it: "Not every site needs the same things. It's a sudoku for them to figure out."
Agencies are already excellent at deploying interventions. The City can provide those agencies the discipline of concentrating them. City government often defaults to spreading resources on a first-in, first-out basis, but violence concentrates geographically, and the response has to concentrate in return. Fifty locations with repeated engagement will have more impact than 500 locations with one-off visits. And because environmental conditions deteriorate (vacant lots refill with trash, code violations recur), the work didn't end after a first pass. The goal wasn't a clean block for a photo. It was sustained change in the conditions that enable violence.
What happened
We know that Dallas improved. Violent crime declined 14.5% citywide, part of a national trend. The question is whether areas that received coordinated intervention fared better than comparable areas that didn't. The team's evaluation framework, comparing intervention areas to non-intervention areas within the same risk tier, provides the clearest test. At every risk level, the answer is yes.
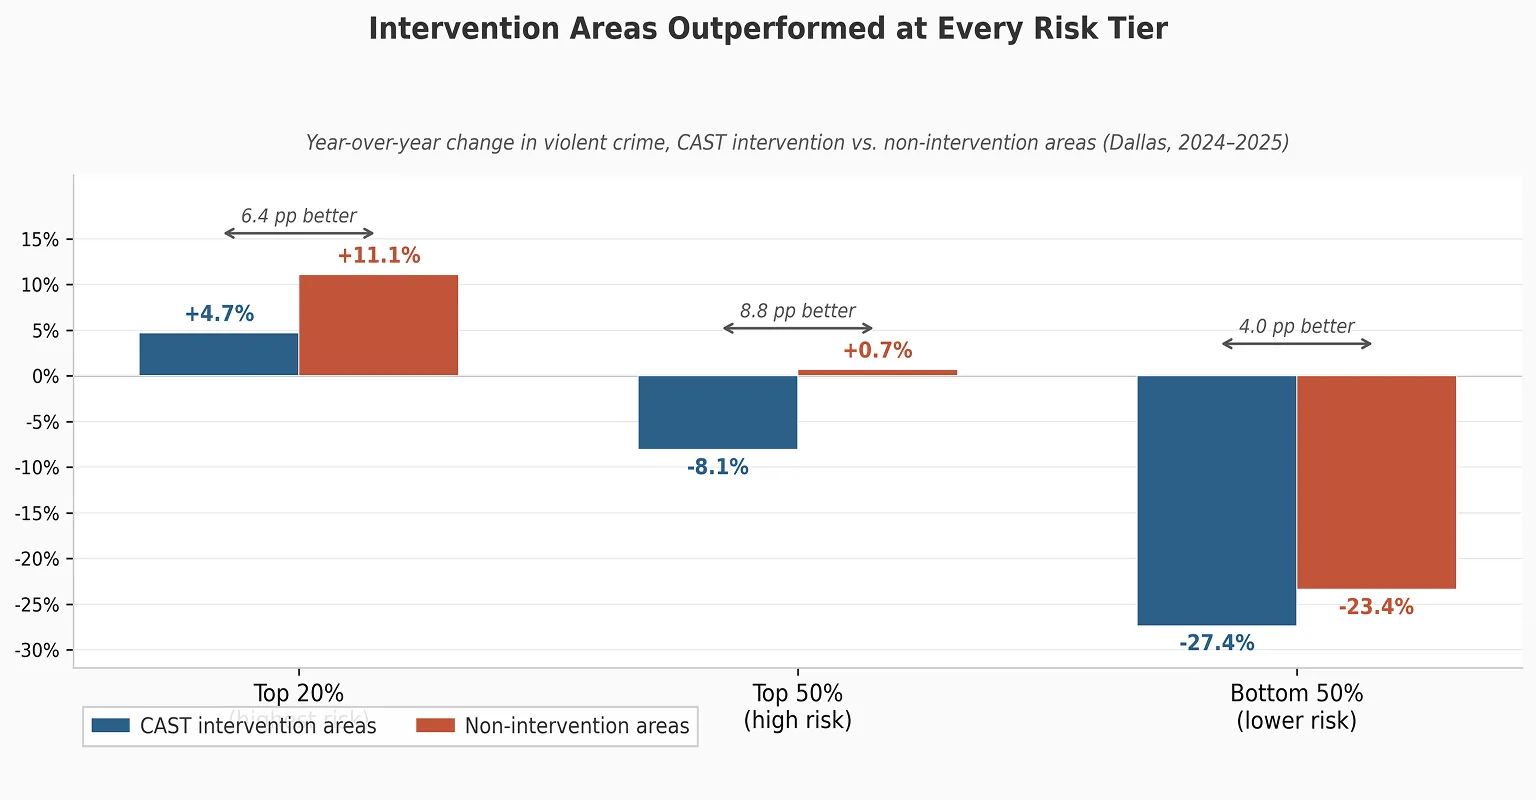
The stabilization effect was clearest in the middle tier: areas with enough crime to be at risk of escalating, but not so entrenched that deeper structural forces dominate. Here, intervention areas declined 8% while comparable non-intervention areas were flat. These are precisely the areas Section 2 identifies as the narrow policy target: the 1–3% of geography at risk of tipping into higher concentration. Intervention pulled them back from that edge.
Even in the highest-risk areas, where crime increased regardless, intervention areas saw less than half the increase of non-intervention areas. Dampening the magnitude of surges matters — it's what keeps a temporary spike from becoming an entrenched hotspot.
The results for homicide specifically were even stronger. At every risk tier, the gap between intervention and non-intervention areas was larger for homicide than for violent crime overall. Appendix E presents the full intervention results, and Appendix F tests their statistical significance using methods appropriate for crime count data.
What this doesn't prove
This is not a randomized controlled trial. Intervention areas weren't assigned randomly; they were chosen because they had high crime and conditions that seemed amenable to environmental intervention. It's possible that something about these areas, beyond the intervention itself, explains part of the difference.
When tested using Poisson-based methods appropriate for crime count data (see Appendix F), the intervention effect is statistically significant in the tier where the theory predicts it should be strongest: areas between the 20th and 50th percentile of crime concentration. In the highest-risk and lowest-risk tiers, the differences go in the same direction but are not statistically significant, largely because the sample sizes are too small to detect the observed effects with confidence. The consistent direction across all tiers is itself notable.
But the consistency of the pattern, and the size of the differences, suggests that targeted, repeated, cross-departmental action made a real contribution. Dallas is one city and one year of data. But it's evidence that this approach can work — and that cities don't have to wait for perfect proof before starting.
Practical Roadmap
The previous sections describe what coordinated, place-based action looks like and the evidence that it works. This section is about how to begin.
The data makes the case for starting: across ten cities, roughly 90% of geography is stable, the broad trend is favorable, and the places where violence is trending the wrong way represent just 1–3% of city geography in any given year. That's roughly 20 to 30 half-mile areas. The challenge is not the size of the problem. It's building the system to detect those areas and get city resources there before conditions entrench.
Any city can launch this approach in 90 days and see measurable outcomes within 180, using existing staff and existing data. This is not a new program. It's a way of directing what city government already does toward the places where it will have the greatest impact, starting with violent crime but extending naturally to the code violations, 311 backlogs, and quality-of-life conditions that concentrate in many of the same places.
What you need
Mayoral commitment. This work only moves if city leadership makes clear that violence reduction is a cross-agency priority, not just a police department problem. Department heads need to hear, directly, that they will be expected to prioritize specific high-violence locations and report on progress. Without that signal from the top, coordination meetings become optional and follow-through fades.
A coordinator. One person (existing staff, not a new hire) who owns the rhythm: scheduling meetings, tracking assignments, flagging stalled cases, and connecting analytical targeting with operational execution. In Dallas, this role sat in the Emergency Management and Crisis Response office. In other cities, it could sit in the mayor's office, the city manager's office, or a public safety coordinator role. The title doesn't matter. What matters is that someone wakes up every Monday thinking about which sites need attention this week.
Two to three invested, capable agency leads at the table. You don't need every relevant department on day one. To start, you need code enforcement and one or two other agencies—sanitation, public works, or transportation—with leads who are willing to show up and do the work. Over time, you can expand to parks, additional public works divisions, and other departments. Within each agency, the right configuration will emerge: in Dallas, code enforcement brought representatives from multiple divisions (field inspections, nuisance abatement, multi-tenant) because the work touched all of them. Start with a small, committed group. The table grows as the work proves its value.
Data to identify priority locations. At minimum, incident-level crime data for homicide, robbery, and aggravated assault with addresses or coordinates—anything geocodable. Most cities already collect this through NIBRS. But crime data alone understates the opportunity. Code violations, 311 complaints, vacancy rates, and lighting outage reports often concentrate in overlapping geography, and they give operational departments a direct reason to engage. Cities that layer these data sources into the targeting process find that the priority list serves multiple departments' missions, not just public safety. A basic crime map is enough to start; richer data sources make the coordination more effective and more durable over time.
A short list of priority locations. Don't try to cover the whole city, and the data says you don't have to. Ninety percent of the city is stable. The Dallas model worked because it concentrated resources on roughly 50–100 locations at a time, few enough to allow repeat engagement, enough to cover the places where violence was most acute. The discipline of a short list is what separates targeted action from business as usual.
What you don't need
New funding. The departments involved already have budgets and staff. Code enforcement already conducts inspections. Sanitation already cleans up dumping. Public works already fixes streetlights. The intervention is redirecting a share of existing capacity toward specific locations, not building something from scratch. The primary upfront investment is analytical: someone needs to pull the crime data, identify priority areas, and match them with appropriate interventions. In most cities, this can be done with existing analysts or a short-term partnership.
Perfect analytics. You don't need a predictive model, a risk-terrain analysis, or a proprietary platform to get started. A map of where violent crime concentrates, built from the data your police department already collects—is sufficient. Analytical sophistication can grow over time, but it should never be the reason you haven't started.
A new department or program. This is a coordination mechanism, not an initiative with its own staff and letterhead. It lives in the space between existing departments, connecting what they already do to where it's most needed. Cities that treat this as a new program risk building something that's easy to defund. Cities that embed it as an operating rhythm make it harder to undo.
The timeline
The framing that guided Dallas, and that we'd recommend for any city, is: 90 days to launch, 180 days to measurable outcomes.
Weeks 1–4: Build the foundation.
Secure explicit commitment from the mayor or city manager. Designate a coordinator. Identify the first two to three agency leads who will participate. Pull crime data and generate an initial list of candidate priority locations. Hold an initial convening to explain the approach, set expectations, and establish the meeting cadence. The goal by the end of month one is a functioning coordination structure with a first round of priority sites.
Weeks 5–8: Assess and deploy.
Conduct field assessments of priority locations: walk the sites, photograph conditions, talk to nearby residents and businesses. Match specific interventions to specific sites: which locations need code enforcement action? Where is the lighting problem? Which lots need clearing? Begin first-round interventions and establish the live tracking system (a shared spreadsheet or project tracker is fine to start). Hold the first full cycle of weekly coordination meetings.
Months 3–6: Build the rhythm.
This is where the model either takes hold or fades. The weekly cadence should be routine by now: strategy meetings to identify new sites and review field work, department meetings to track cases and assign follow-ups. The key indicator isn't how many cleanups you've done; it's whether high-priority locations are receiving repeat engagement. Sites should stay on the list until conditions have stabilized, not until the first intervention is complete. By month six, the coordinator should be able to report on which sites have been closed out, which are still active, and how intervention areas are performing relative to comparable non-intervention areas.
Month 6 and beyond: Assess, refine, institutionalize.
Evaluate results. Are intervention areas outperforming comparable non-intervention areas? Which types of interventions seem most effective in which contexts? Refine the priority list based on updated crime data. Identify what's working and expand it; identify what isn't and adjust. The goal is to shift from a pilot to an institutional rhythm, something that happens every week because it's how the city operates, not because someone is championing a project.
Common pitfalls
Cities that have attempted place-based coordination tend to encounter the same failure modes. Knowing them in advance makes them easier to avoid.
Spreading too thin. The instinct in city government is to serve the whole city equally. It feels politically safer than concentrating resources in specific areas. But even distribution is the default that these neighborhoods have been living under, and it isn't working. The data shows that roughly 20–30 areas in a typical city are trending toward escalation at any given time. That's a manageable list. Fifty locations with sustained, repeat engagement will have more impact than 500 locations with a single visit. The discipline of saying "these blocks first" is what makes this approach different from business as usual.
Confusing activity with impact. Counting cleanups, inspections, and lighting repairs feels productive. But the measure of success isn't how many work orders you've completed; it's whether violence is declining in the places you're targeting. Track interventions, but evaluate outcomes. If a location has received multiple rounds of engagement and conditions haven't improved, that's a signal to reassess the approach, not to keep doing the same thing.
Skipping the data. This model depends on knowing where. Without crime data to identify priority locations, you're guessing, and in most cities, the guess will be wrong. The areas that show up in 311 complaints or council constituent calls aren't always the areas with the highest violence. Data doesn't need to be perfect, but it needs to exist.
Letting the cadence slip. Weekly meetings sound easy until competing priorities push them to biweekly, then monthly, then "as needed." The coordination rhythm is the engine. When it stops, so does follow-through. Protect the meeting cadence the way you'd protect any critical management function. If the coordinator is out, someone else runs the meeting. It doesn't get canceled.
Treating this as a one-time campaign. Environmental conditions deteriorate. Vacant lots refill with trash. Code violations recur. Absentee landlords don't change behavior after a single citation. A cleanup that makes a block look better for a week isn't a violence reduction strategy. Sustained change requires sustained attention. The cities that get results are the ones that commit to being in these places repeatedly, over months, not the ones that launch a visible push and move on.